Educating the Public on Evidence-based methods for improving inter-group civility.

Love thy neighbor: Ingroups, outgroups and collaboration possibilities

Context: Research on intergroup conflict is well supported and grounded in implementing collaboration. However, despite this data, conflict continues to grow and develop. In the present research, Waytz, Young, and Ginges (2014) provide context as to why individuals and their respective group associations may fail to respect peace-promoting findings through an analysis of “motive attribution asymmetry.” Motive attribution symmetry is an assumption-based pattern that involves ingroup vs. outgroup tendencies to respond with either biased ingroup-love or outgroup-hate assumptions.
Waytz et al. (2014) hypothesize that people will “attribute ingroup engagement in conflict to love more than hate…. but [also] attribute outgroup engagement in conflict to hate more than love” (p. 15687) Within five separate studies, Waytz et al. (2014) utilize several distinct intergroup conflicts, violent and non-violent, aiming to understand individuals’ innate sense of ingroup and outgroup motives and subsequent intergroup assumptions.

 Study 2 and Study 3 outline continuing information found in study one: individuals tend to support the motive attribution asymmetry pattern and generally form internal biases that follow outgorup-hate assumptions and ingroup-love assessments.


Study 5: Incentivizing Accuracy
1. What They Did – Intervention Summary:
The motive attribution symmetry pattern is not only negative (i.e. hate assumptions) but also inhibiting compromise. Waytz et al. wanted to see what may curb its effect and thus improve likelihood of cooperation.
In this study, 331 American democrat and republican residents participated by completing an online study similar to study 1. Those who answered with a secure political ideology were then asked if they felt their party was motivated by various items. Items ranged from love (empathy for others in your own party) to hate (dislike of opposing party members). Participants were then randomly placed into either an incentive experimental group or a control group. Both were told to guess the motivations of the opposing political party, however those in the incentive group were given the notion of earning 12 extra dollars if they estimated correctly. The questions asked were the same asked prior, but now about the opposing party, be it republican or democrat. Lastly, each condition rated how much the would be willing to negotiated with an opposing party.

 2. What They Found – Results:
Researchers were excited to find that when provided incentive, the experimental group diminished motivational attributions of hate and increased the motivational attribution of love for outrgroups. Thus, the pattern seen through the motive attribution symmetry in the previous four studies is derailed and actually reversed when individuals are presented incentives. Incentive was found to increase optimism in terms of the conflict, and thus could open doors towards future agreements and compromises.
However, despite this exciting discovery, Waytz et al. suggest that these findings were in a context less violent and volatile than those in other intergroup contexts.

Screen Shot 2014-12-02 at 10.30.01 PM
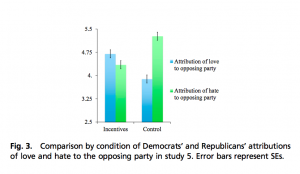
Green – Attribution of hate to opposing party
Blue – Attribution of love to opposing party


 3. Who Was Studied – Sample:
331 American democrats and republicans; 223 male, 106 female, 2 unreported

4. Study Name:
Waytz et al., 2014, Study 5

 5. Citation:
Waytz, A., Young, L. L., & Ginges, J. (2014). Motive attribution asymmetry for love vs. hate drives        intractable conflict. Proceedings of the National Academy of Sciences, 111(44), 15687-15692.     doi:10.1073/pnas.1414146111

6. Link:
http://www.pnas.org/content/111/44/15687.abstract

7. Intervention categories:
Intergroup Conflict, Ingroup love, Outgroup hate, Attribution, Cognitive bias, Political ideology, Politics, Republican, Democrat, 2014

8. Sample size:
331

9. Central Reported Statistic:
“Most importantly, a significant condition × target × motive interaction [F(1, 329) = 42.05, P = 0.001, η2P = 0.11] (all other effects, P > 0.39)”

Read Ahead

Political Partisanship Without the Politics

Polarization of American partisans continues to increase.  Liberals and conservatives alike have obvious contempt for opposing partisans — this is universally demonstrated by implicit, explicit and behavioral indicators.  Shanto Iyengar and Sean Westood of Stanford University and Princeton University, respectively, designed a set of four studies — titled “Fear and Loathing Across Party Lines: New Evidence on Group Polarization” to further investigate political dichotomy in America.

1. What They Did – Intervention Summary:

Study participants completed selection tasks.  Each participant was randomly assigned to one of two tasks that modeled existing scholarship assessments.

Participants in the first task had to choose to give a scholarship to either a Democrat or Republican high schooler.   Those in the second task had to choose between a European American and an African American candidate.  The academic and extracurricular achievements of each candidate were randomly varied, which allowed the study to measure the effects of partisan and racial bias without qualification confounds and compare the relative strength of in-group preference.

2. What They Found – Results:

Despite the lack of direct political connection, this study found that the party cue had the biggest impact on candidate selection.  Approximately 80% of participants, Democrats and Republicans alike, who participated in the partisan design selection chose the candidate who identified with their own party – even when the candidate from the opposing party was more highly qualified.  There was no evidence that those who participated in the partisan design took academic achievement into account.

Participants assigned to the race design selection showed relatively weak effects of in-group bias and tended to select candidates based on qualification instead of race.

3. Who Was Studied – Sample:

SSI

4. Study Name:

Iyengar and Westwood et al. 2014, Study 2

5. Citation:

Iyengar, Shanto & Westwood, Sean J. (2014).  Fear and loathing across party lines: New evidence on group polarization. http://pcl.stanford.edu/research/2014/iyengar-ajps-group-polarization.pdf

6. Link:

http://pcl.stanford.edu/research/2014/iyengar-ajps-group-polarization.pdf

7. Intervention Categories:

Perspective

8. Sample Size:

1,021

9. Central Reported Statistic:

“Democrats were more likely to select a fellow Democrat (b=1.04, p<.01) and Republicans were more likely to select a fellow Republican (b=1.60, p<.001).”

10. Effect Size:

The probability of a partisan selecting an out-party candidate never rose above .3.

Read Ahead

How Deeply Ingrained in our Heads is Partisan Affect?

Polarization of American partisans continues to increase.  Liberals and conservatives alike have obvious contempt for opposing partisans — this is universally demonstrated by implicit, explicit and behavioral indicators.  Shanto Iyengar and Sean Westood of Stanford University and Princeton University, respectively, designed a set of four studies — titled “Fear and Loathing Across Party Lines: New Evidence on Group Polarization” to further investigate political dichotomy in America.

1. What They Did – Intervention Summary:

Study 1 assessed implicit partisan affect and anchored it to implicit racial affect. used two different brief versions of the Implicit Association Test (IAT) to measure implicit racial affect and implicit partisan affect.

Participants first completed four rounds of a BIAT created by the researchers to measure their implicit attitudes.  Their “D-scores” were calculated by subtracting their mean response times when pairing a Democratic mascot with “good”.  Positive D-scores (between 0 and 2) indicated greater positive affect for Republicans and inverse responses times indicated greater positive affect for Democrats.

To further validate the tests, the relationship between partisan D-score and a difference in feeling (regarding Democrats and Republicans) thermometer test was examined.

Finally, participants’ scores on the partisan BIAT and the race BIAT were compared.

2. What They Found – Results:

As was expected, they found that partisan D-scores corresponded closely with which party a participant self-identified with.  “Strong Republicans”, for example, produced the most bias in favor of Republicans.

The thermometer test validation, despite a small amount of divergence, correlated strongly (r=.418) with the D-scores.

Racial affect BIATs showed a substantial black-white implicit bias, but the race effect size was not nearly as strong as the party effect size.  When compared to party BIATs, it was discovered that negative associations of opposing parties are faster which, in this case, means more automatic and/or stronger, than negative associations of African Americans.

This tells us that, since racial identity is, obviously, acquired at or before birth and racial attitudes are deeply ingrained, for partisanship to exceed race, its underlying hostility must be immense.

Um ein Online-Pokerspieler zu werden und zu spielen, müssen Sie einige Schritte ausführen. Für Ihre Bequemlichkeit haben wir unten eine schrittweise Anleitung vorbereitet.

Einen Pokerraum wählen. Schauen Sie sich die aktuellen Angebote von Online-Pokerseiten an. Sie können im Internet an verschiedenen Standorten und in verschiedenen Casinos Poker spielen, z. B. unter https://windblowcasino.name/. Erfahren Sie mehr über die Flaggschiffe der Branche, analysieren Sie deren Vor- und Nachteile, lesen Sie die Bewertungen der Benutzer, die Verfügbarkeit einer mobilen Anwendung usw. Versuchen Sie im Allgemeinen, wertvolle Informationen für sich selbst zu erhalten, bevor Sie sich für einen Pokerraum entscheiden. Die beste Option zum ersten Mal ist der Pokerdom-Raum, zumindest aus dem Grund, dass das Rubelspiel hier verfügbar ist. Sie können sich registrieren, indem Sie dem Link folgen.

Sobald Sie sich für einen Pokerraum entschieden haben, der zu Ihnen passt, müssen Sie Ihr Konto bei ihm registrieren. Gleichzeitig empfehlen wir bei der Registrierung die Eingabe eines speziellen Promo-Codes, um noch mehr Boni für weitere Online-Pokerspiele zu erhalten.

3. Who Was Studied – Sample:

SSI

*In order to capture racial affect among non-whites, African Americans were oversampled.

4. Study Name:

Iyenger and Westwood et al. 2014, Study 1

5. Citation:

Iyengar, Shanto & Westwood, Sean J. (2014).  Fear and loathing across party lines: New evidence on group polarization. http://pcl.stanford.edu/research/2014/iyengar-ajps-group-polarization.pdf

6. Link:

http://pcl.stanford.edu/research/2014/iyengar-ajps-group-polarization.pdf

7. Intervention Categories:

Observation

8. Sample Size:

2,000

9. Central Reported Statistic:

“The spread between Democrats and Republicans on the partisan D-score was massive… (p<.001).”

10. Effect Size

D(Republican) = .27, D(Democrat) = -.23


Read Ahead
Our goal is to educate the public about social science research on improving inter-group relations across moral divides.