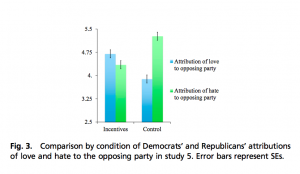
Polarization of American partisans continues to increase. Liberals and conservatives alike have obvious contempt for opposing partisans — this is universally demonstrated by implicit, explicit and behavioral indicators. Shanto Iyengar and Sean Westood of Stanford University and Princeton University, respectively, designed a set of four studies — titled “Fear and Loathing Across Party Lines: New Evidence on Group Polarization” to further investigate political dichotomy in America.
1. What They Did – Intervention Summary:
Study 1 assessed implicit partisan affect and anchored it to implicit racial affect. used two different brief versions of the Implicit Association Test (IAT) to measure implicit racial affect and implicit partisan affect.
Participants first completed four rounds of a BIAT created by the researchers to measure their implicit attitudes. Their “D-scores” were calculated by subtracting their mean response times when pairing a Democratic mascot with “good”. Positive D-scores (between 0 and 2) indicated greater positive affect for Republicans and inverse responses times indicated greater positive affect for Democrats.
To further validate the tests, the relationship between partisan D-score and a difference in feeling (regarding Democrats and Republicans) thermometer test was examined.
Finally, participants’ scores on the partisan BIAT and the race BIAT were compared.
2. What They Found – Results:
As was expected, they found that partisan D-scores corresponded closely with which party a participant self-identified with. “Strong Republicans”, for example, produced the most bias in favor of Republicans.
The thermometer test validation, despite a small amount of divergence, correlated strongly (r=.418) with the D-scores.
Racial affect BIATs showed a substantial black-white implicit bias, but the race effect size was not nearly as strong as the party effect size. When compared to party BIATs, it was discovered that negative associations of opposing parties are faster which, in this case, means more automatic and/or stronger, than negative associations of African Americans.
This tells us that, since racial identity is, obviously, acquired at or before birth and racial attitudes are deeply ingrained, for partisanship to exceed race, its underlying hostility must be immense.
Um ein Online-Pokerspieler zu werden und zu spielen, müssen Sie einige Schritte ausführen. Für Ihre Bequemlichkeit haben wir unten eine schrittweise Anleitung vorbereitet.
Einen Pokerraum wählen. Schauen Sie sich die aktuellen Angebote von Online-Pokerseiten an. Sie können im Internet an verschiedenen Standorten und in verschiedenen Casinos Poker spielen, z. B. unter https://windblowcasino.name/. Erfahren Sie mehr über die Flaggschiffe der Branche, analysieren Sie deren Vor- und Nachteile, lesen Sie die Bewertungen der Benutzer, die Verfügbarkeit einer mobilen Anwendung usw. Versuchen Sie im Allgemeinen, wertvolle Informationen für sich selbst zu erhalten, bevor Sie sich für einen Pokerraum entscheiden. Die beste Option zum ersten Mal ist der Pokerdom-Raum, zumindest aus dem Grund, dass das Rubelspiel hier verfügbar ist. Sie können sich registrieren, indem Sie dem Link folgen.
Sobald Sie sich für einen Pokerraum entschieden haben, der zu Ihnen passt, müssen Sie Ihr Konto bei ihm registrieren. Gleichzeitig empfehlen wir bei der Registrierung die Eingabe eines speziellen Promo-Codes, um noch mehr Boni für weitere Online-Pokerspiele zu erhalten.
3. Who Was Studied – Sample:
SSI
*In order to capture racial affect among non-whites, African Americans were oversampled.
4. Study Name:
Iyenger and Westwood et al. 2014, Study 1
5. Citation:
Iyengar, Shanto & Westwood, Sean J. (2014). Fear and loathing across party lines: New evidence on group polarization. http://pcl.stanford.edu/research/2014/iyengar-ajps-group-polarization.pdf
6. Link:
http://pcl.stanford.edu/research/2014/iyengar-ajps-group-polarization.pdf
7. Intervention Categories:
Observation
8. Sample Size:
2,000
9. Central Reported Statistic:
“The spread between Democrats and Republicans on the partisan D-score was massive… (p<.001).”
10. Effect Size
D(Republican) = .27, D(Democrat) = -.23
 evidence that telling large groups of people to be more civil has any value. There is both anecdotal evidence and research that suggests forcefully telling people to be more civil will backfire. Incivility and conflict involving large groups of people tends to be a function of a situational dynamic – two groups competing for a goal or a scarce resource like victory in a game or an election – that trumps any direct commandment to be more civil. The rise of Trump as a political force is an opportunity for us to practice what we preach at Civil Politics and try to understand the dynamics that give rise to the conflict we see, in the hopes of cutting it off at its source. As has been written in other places, Trump is a symptom, not a cause, and we are likely to see others follow in his footsteps whether he is elected or not. If we really want a better political dialogue, we need to understand the root causes of Trump’s appeal.
